As the UK population grows and the roads in urban centres become more congested with motor vehicles, cycling has become widely encouraged, especially since the COVID-19 pandemic in 2020.
If you’re looking for specific statistics surrounding cycling in the UK, you’re in the right place.
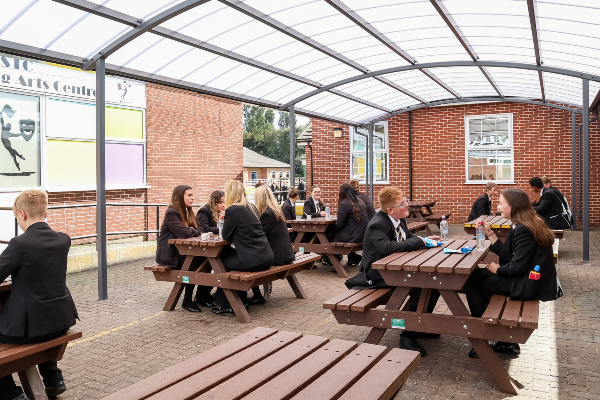
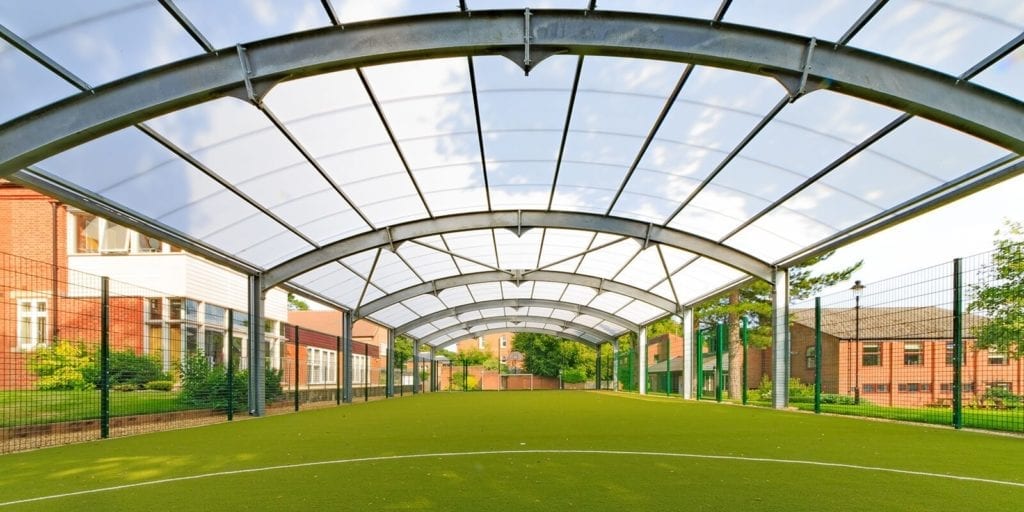
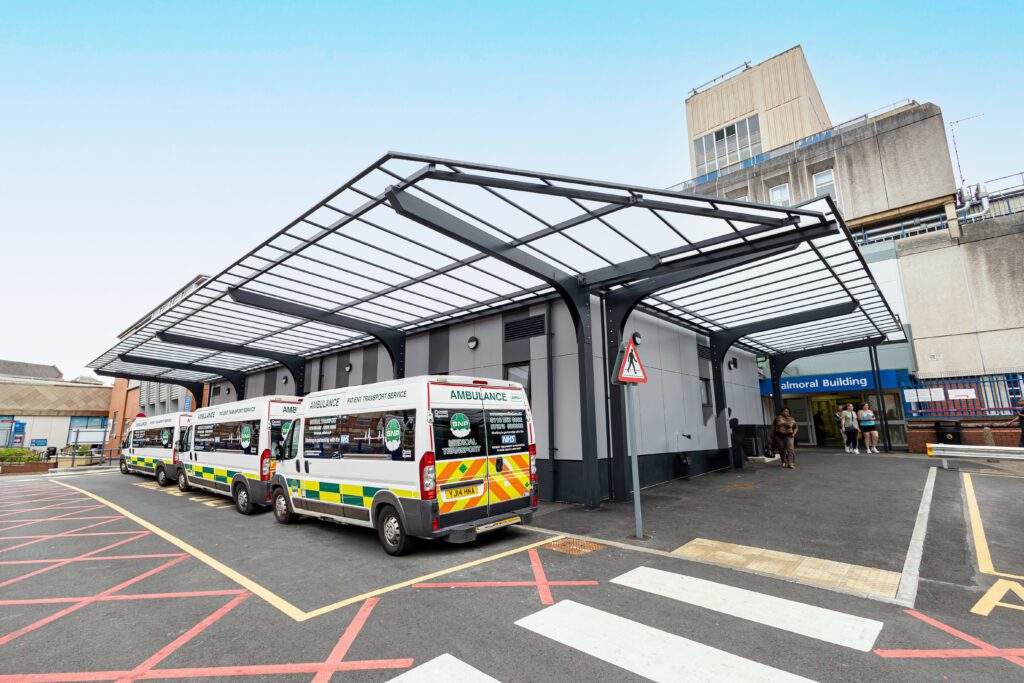
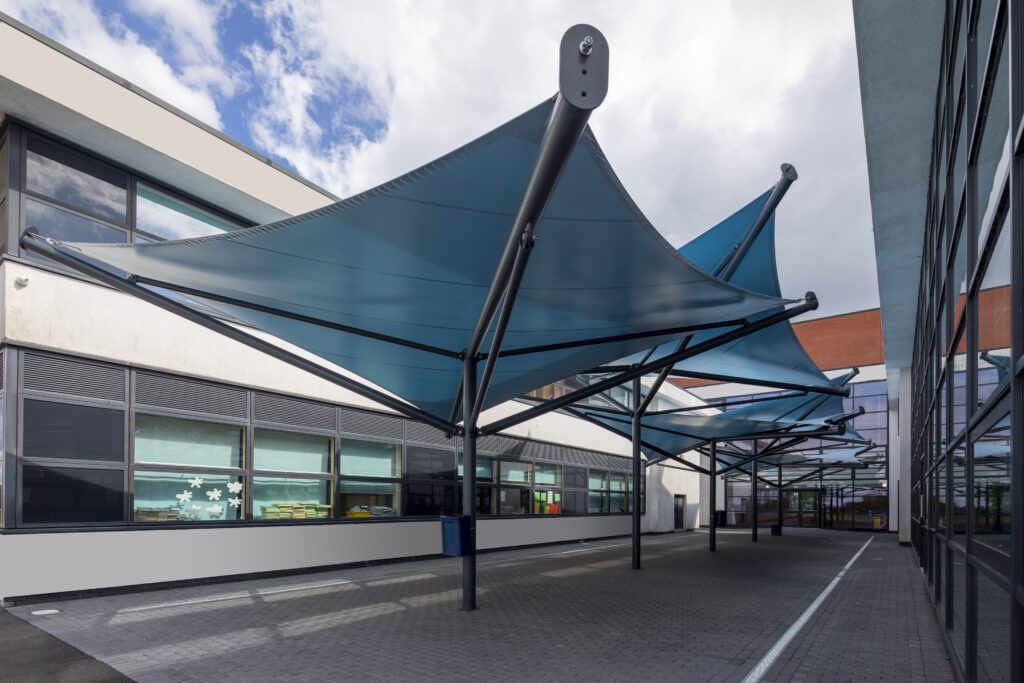
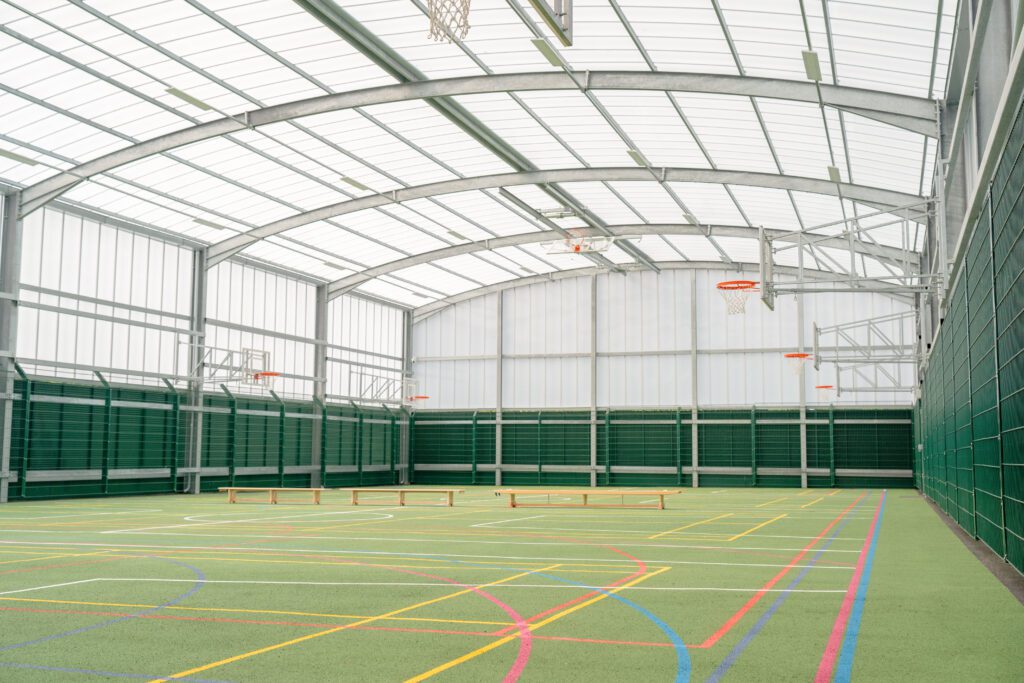
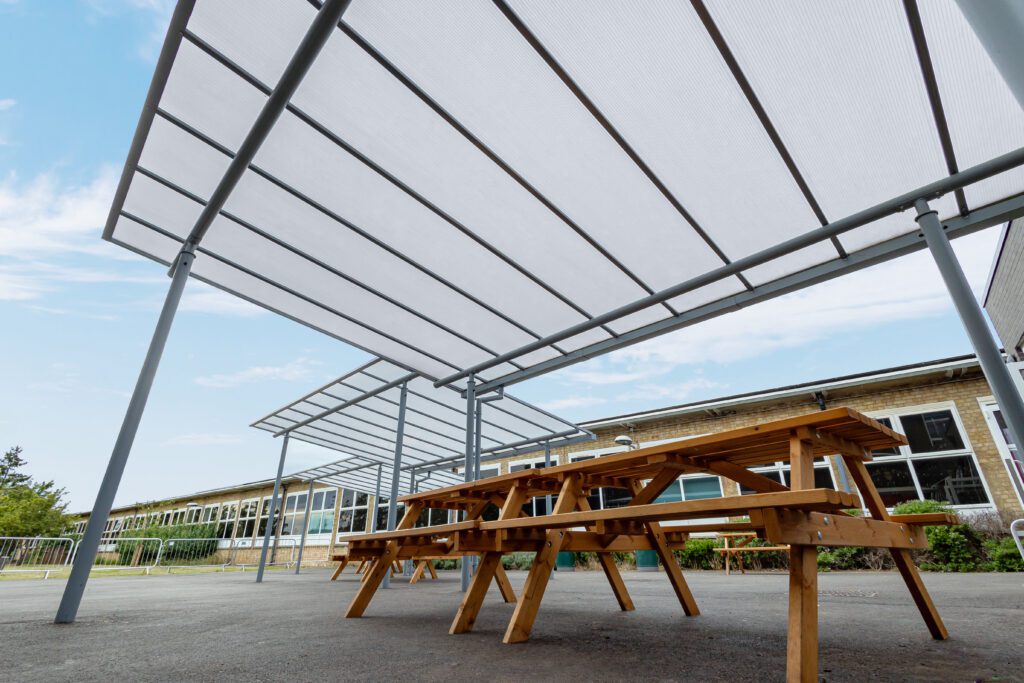
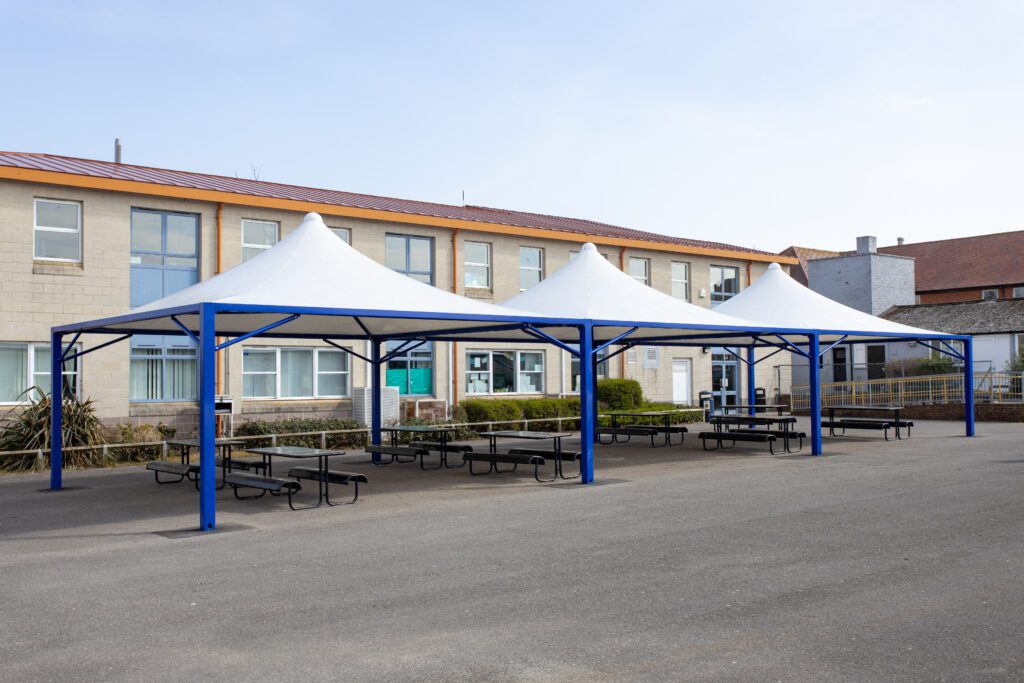
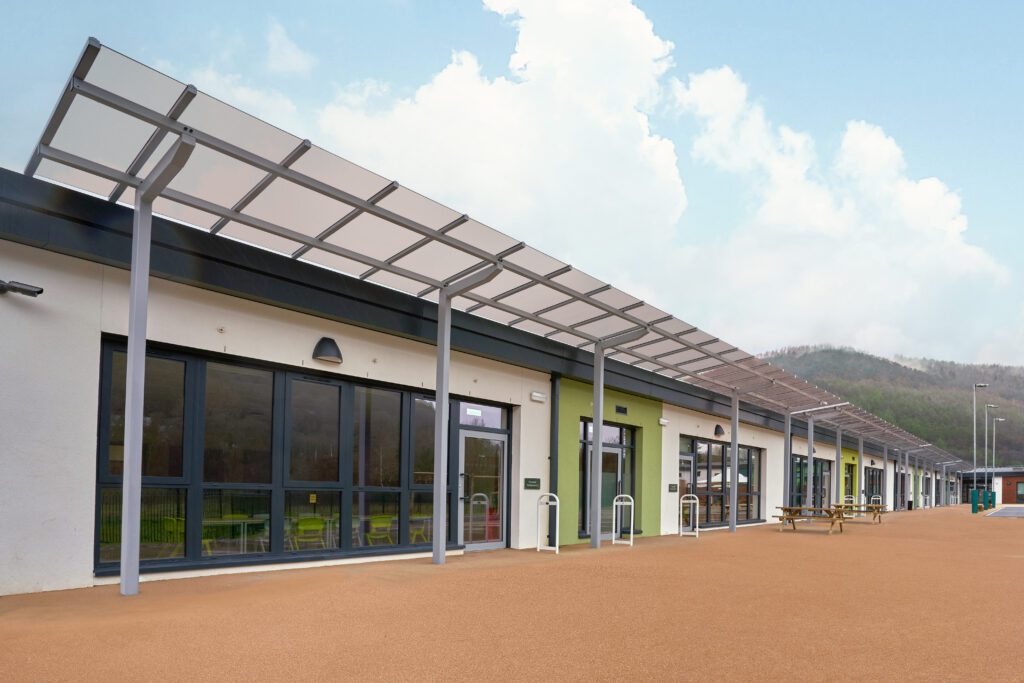
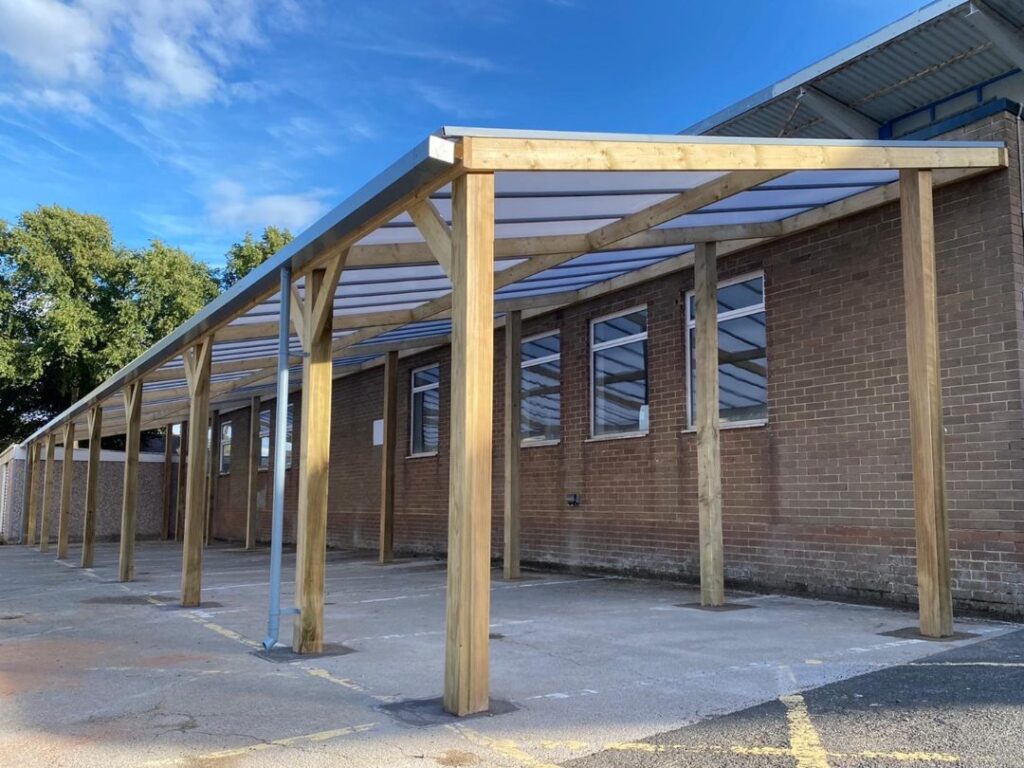
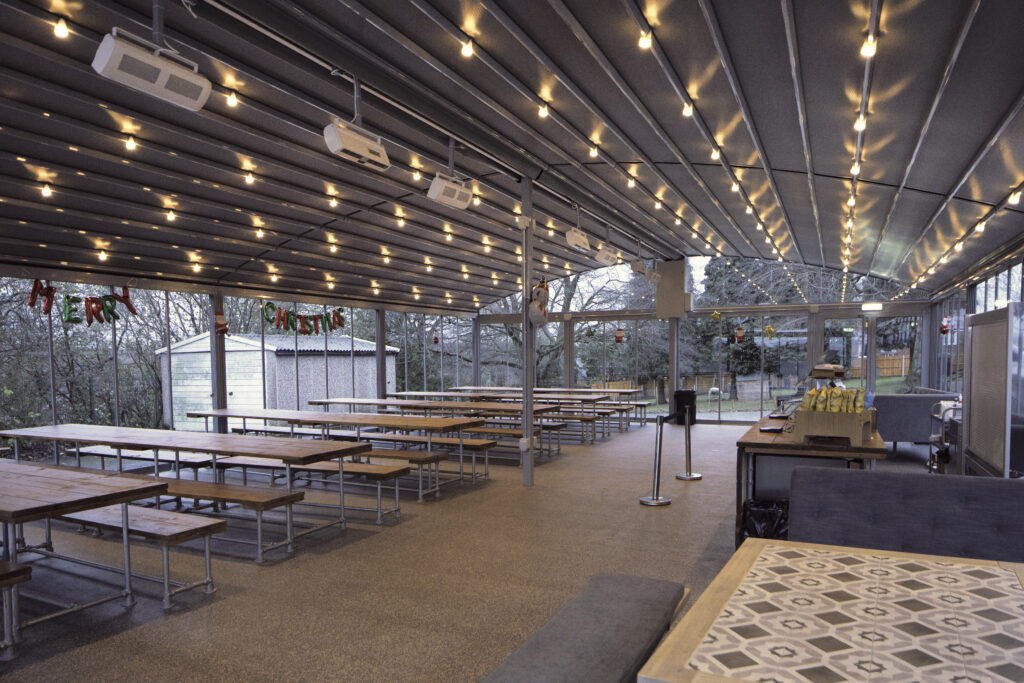
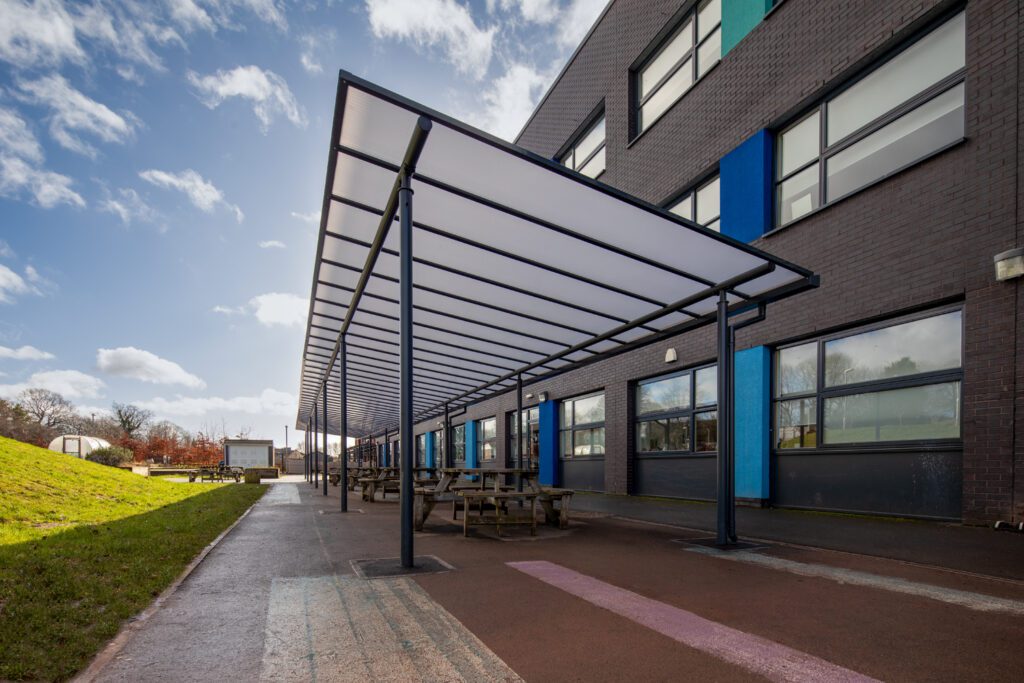
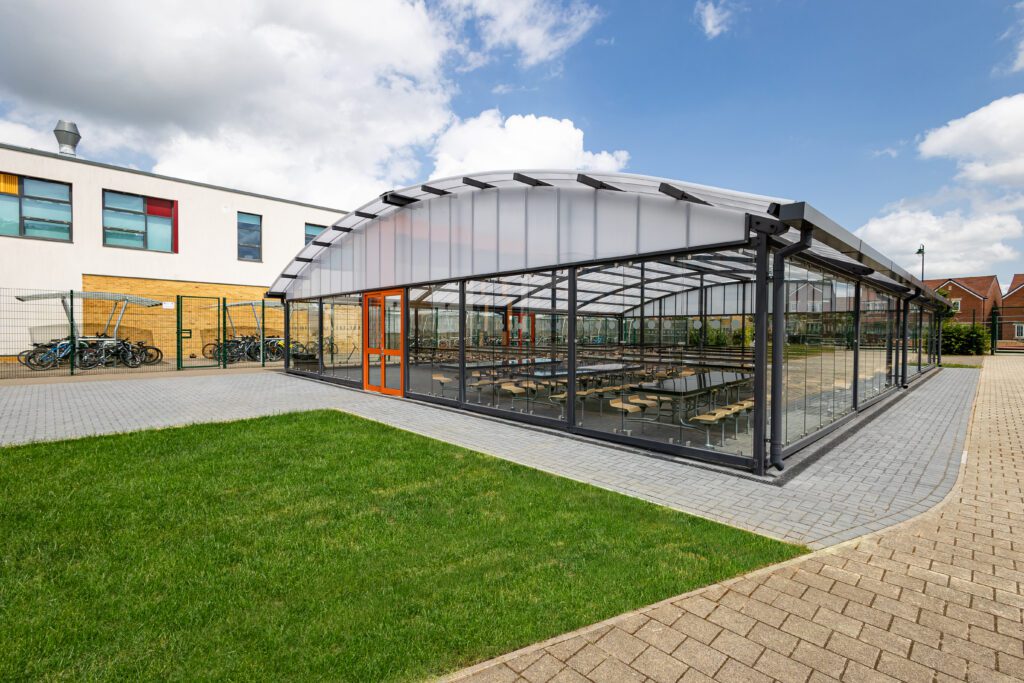
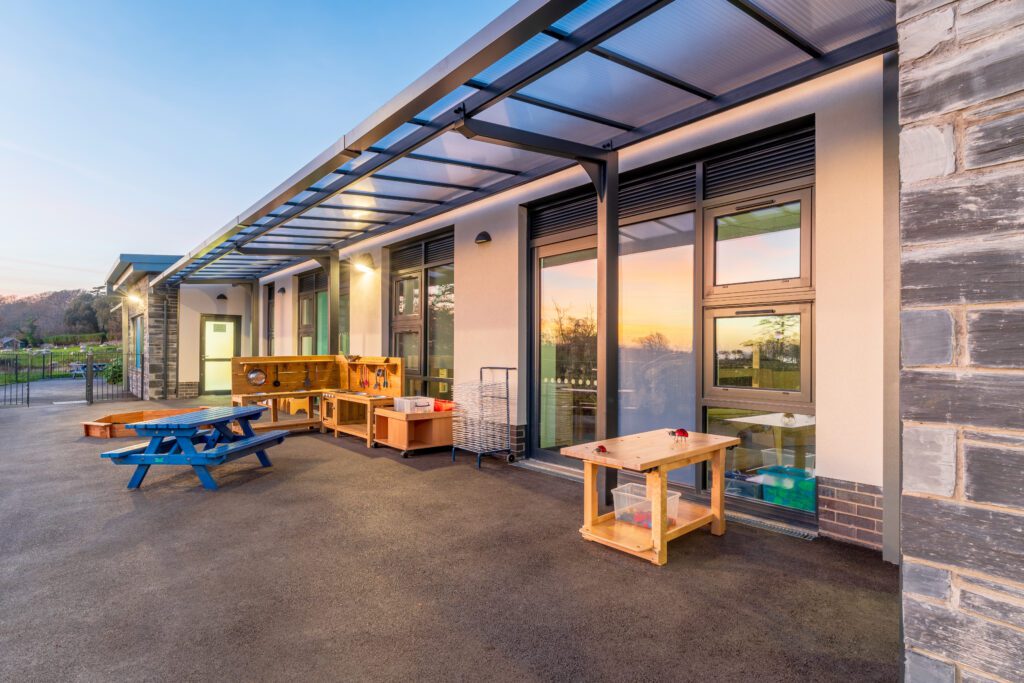
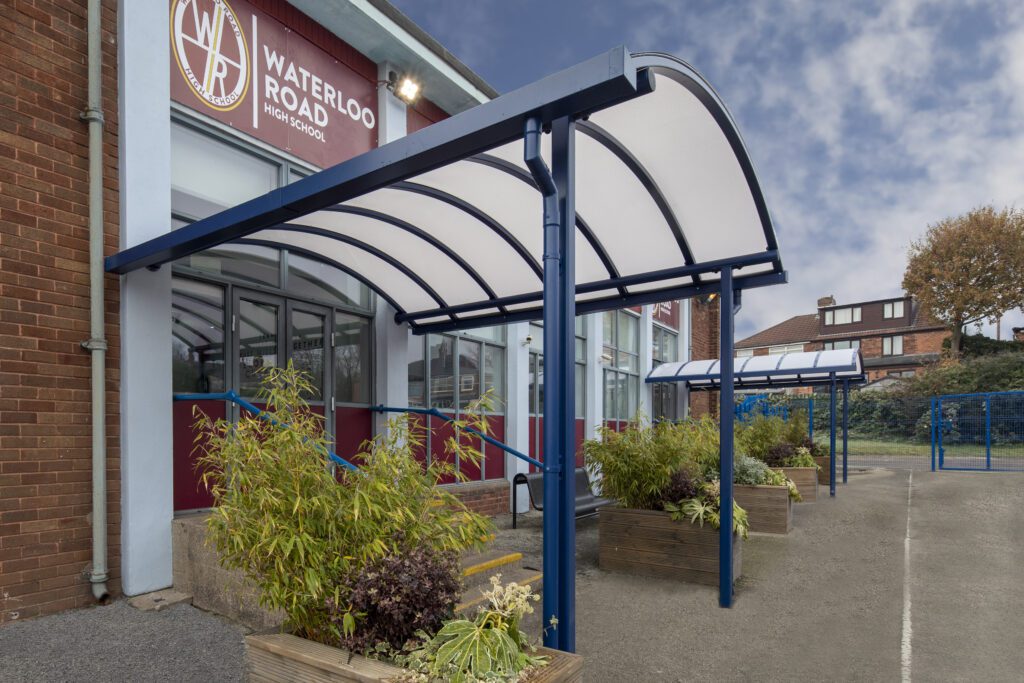
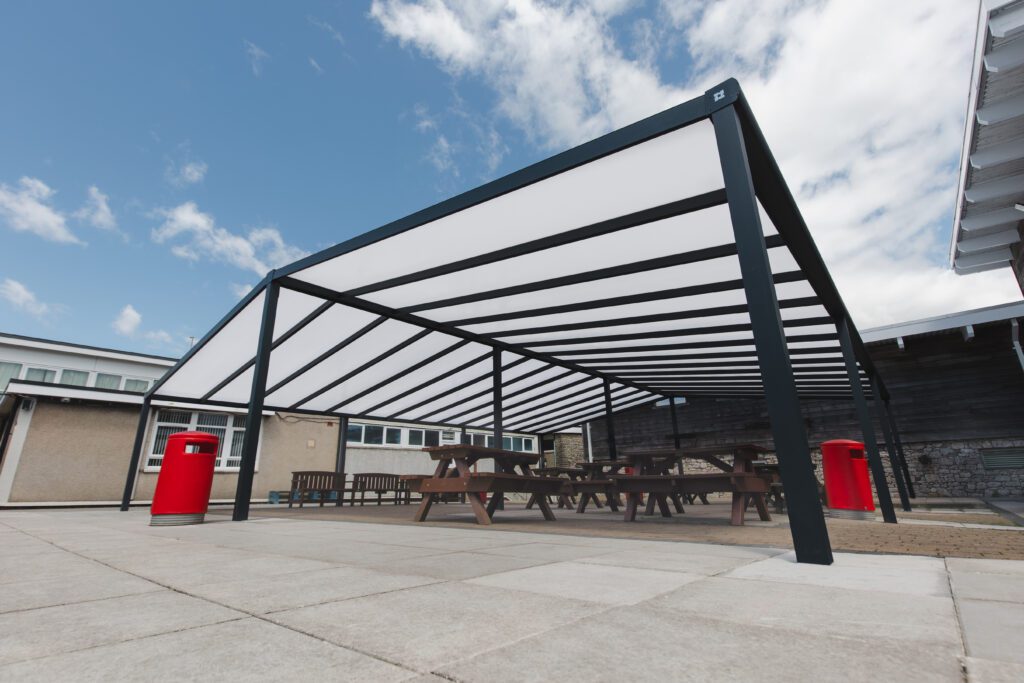
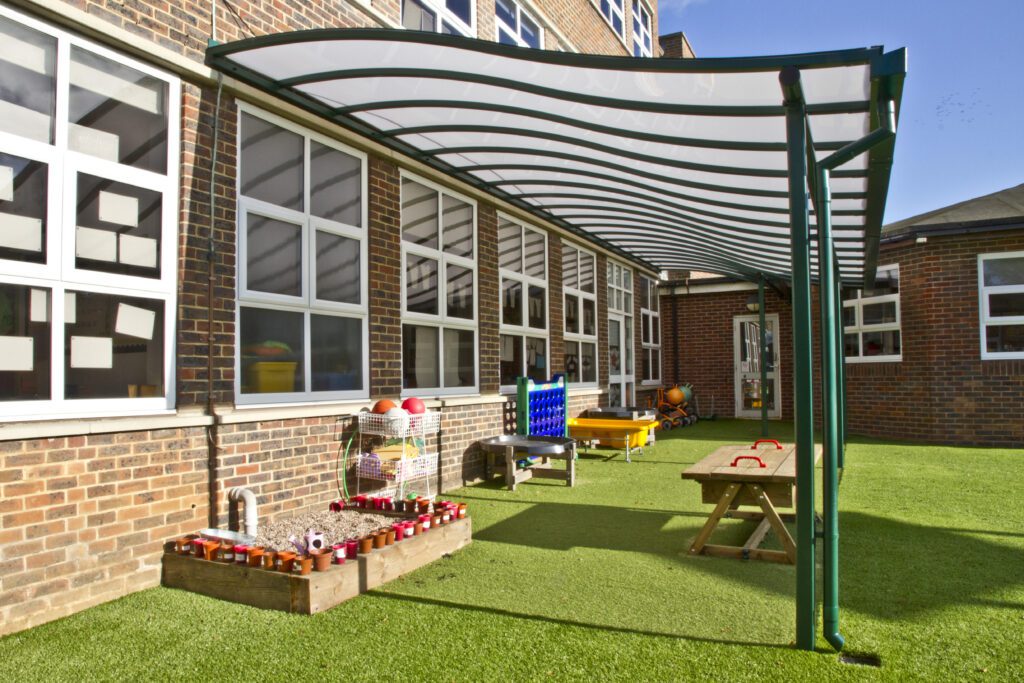
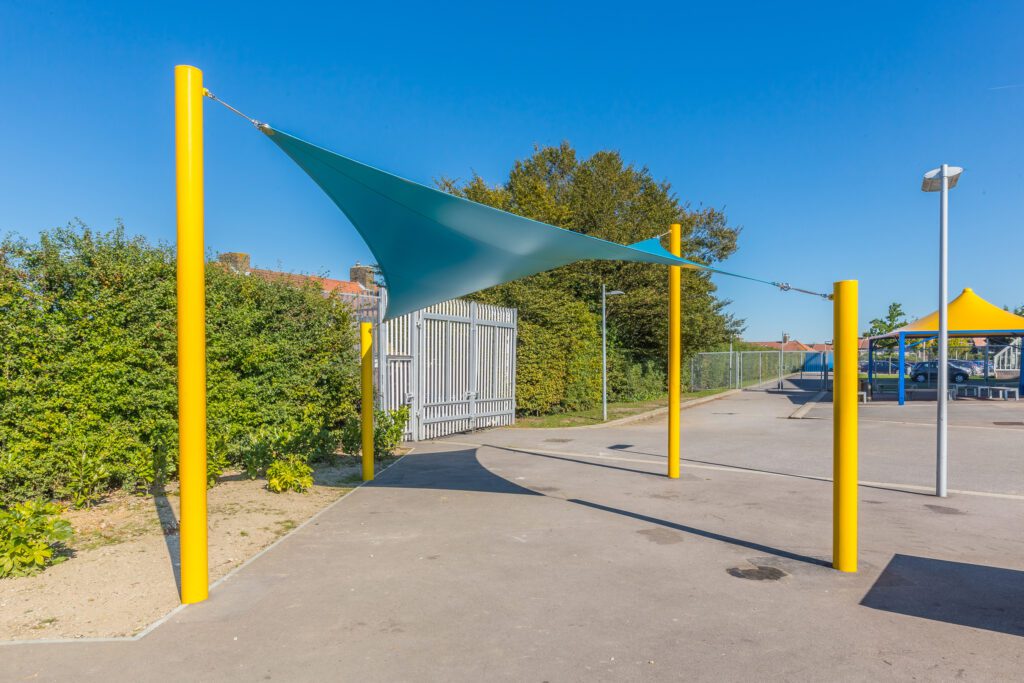
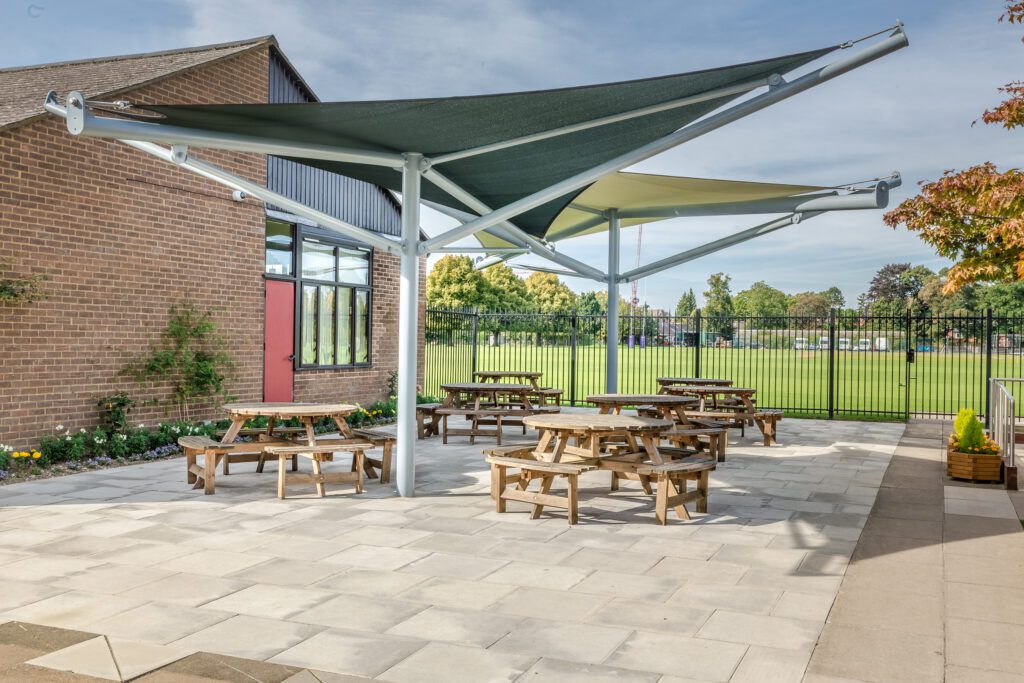
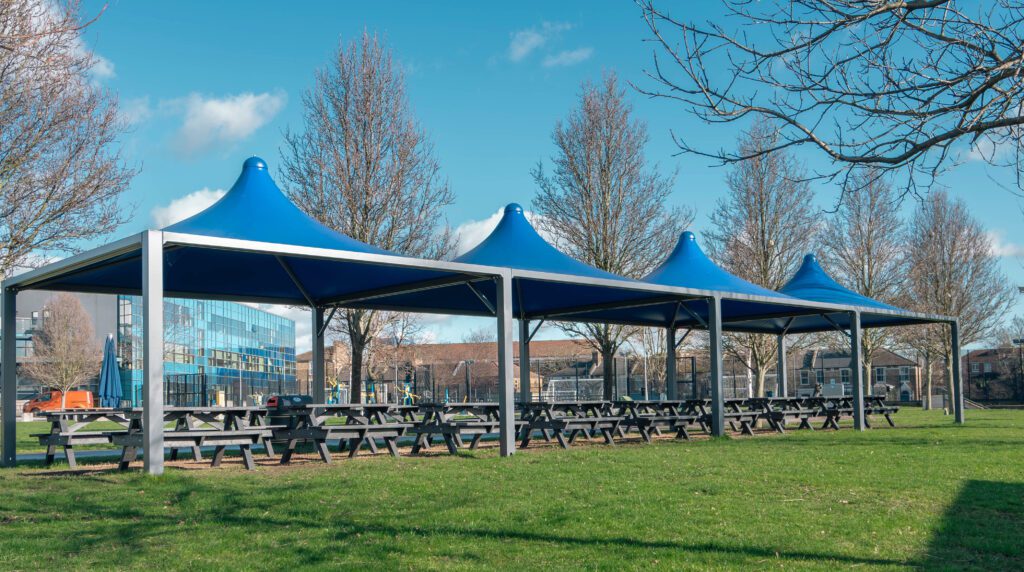
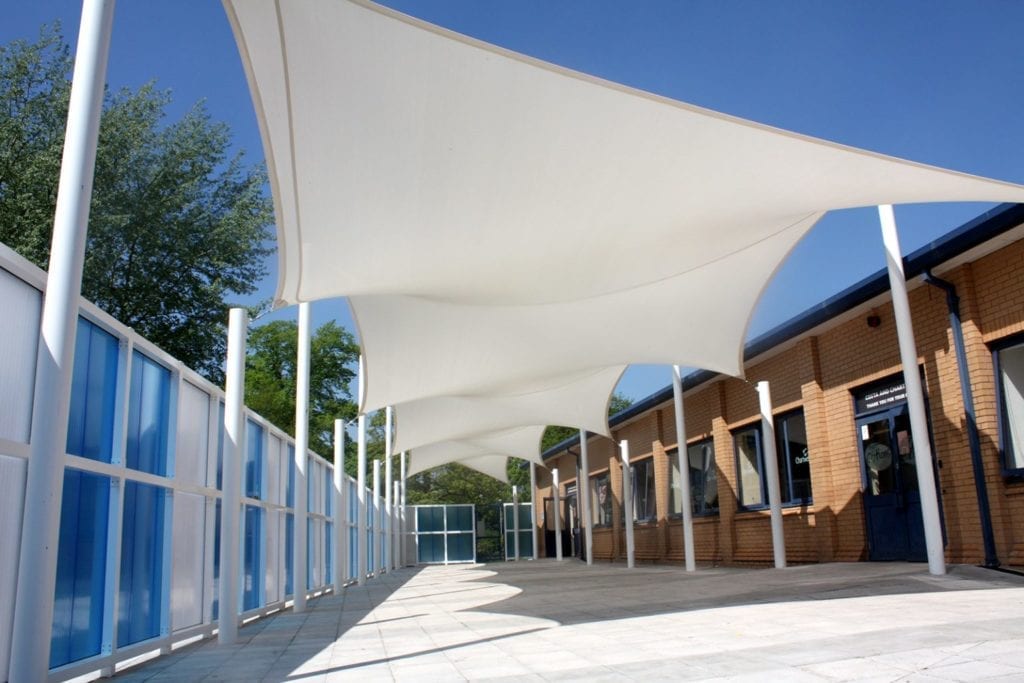
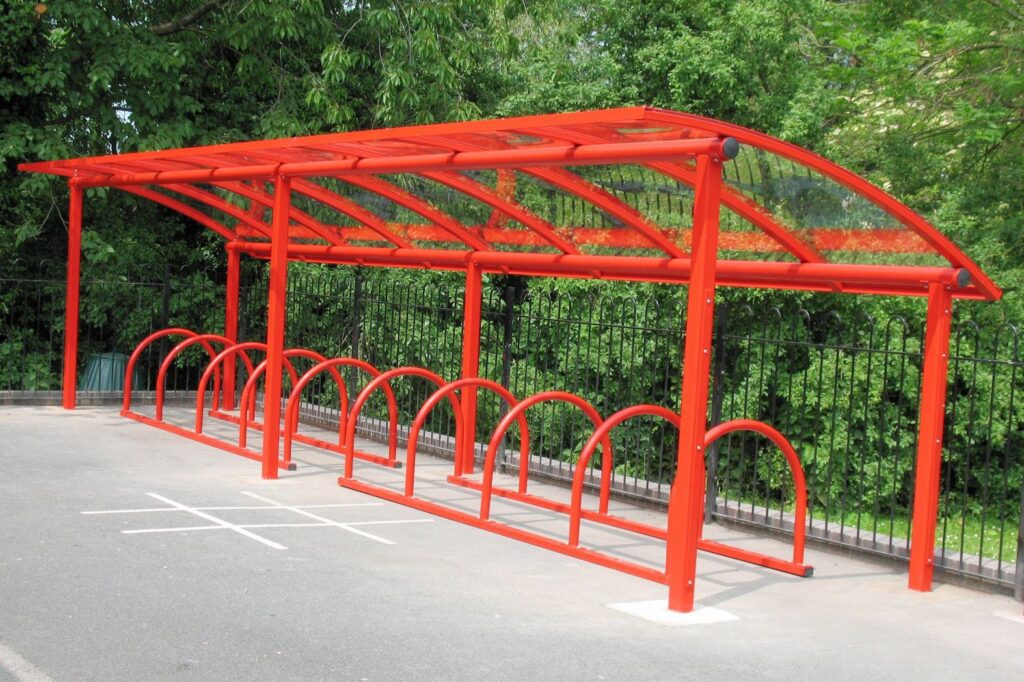
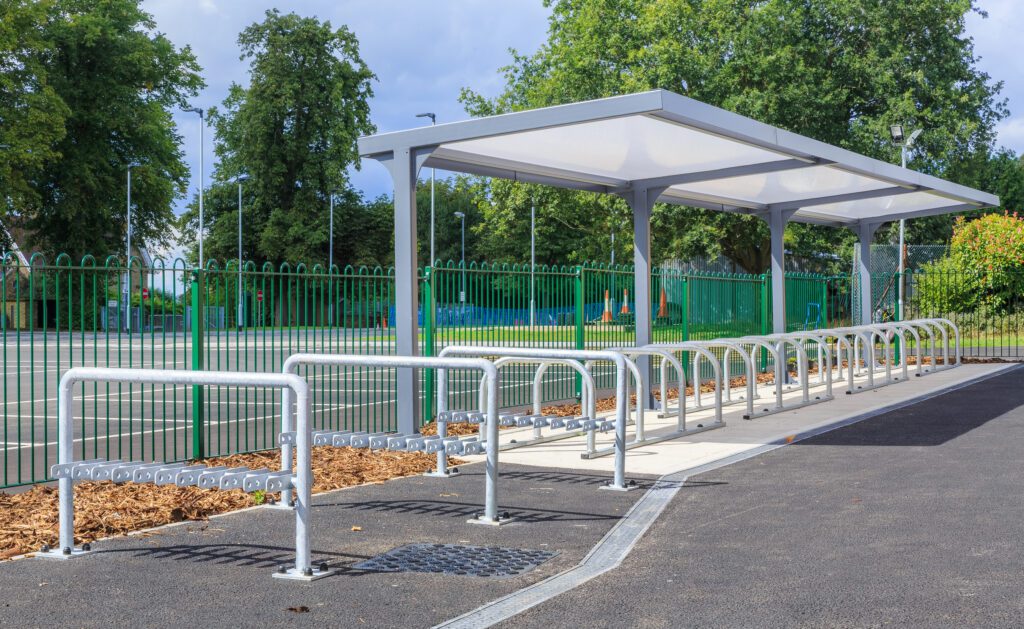
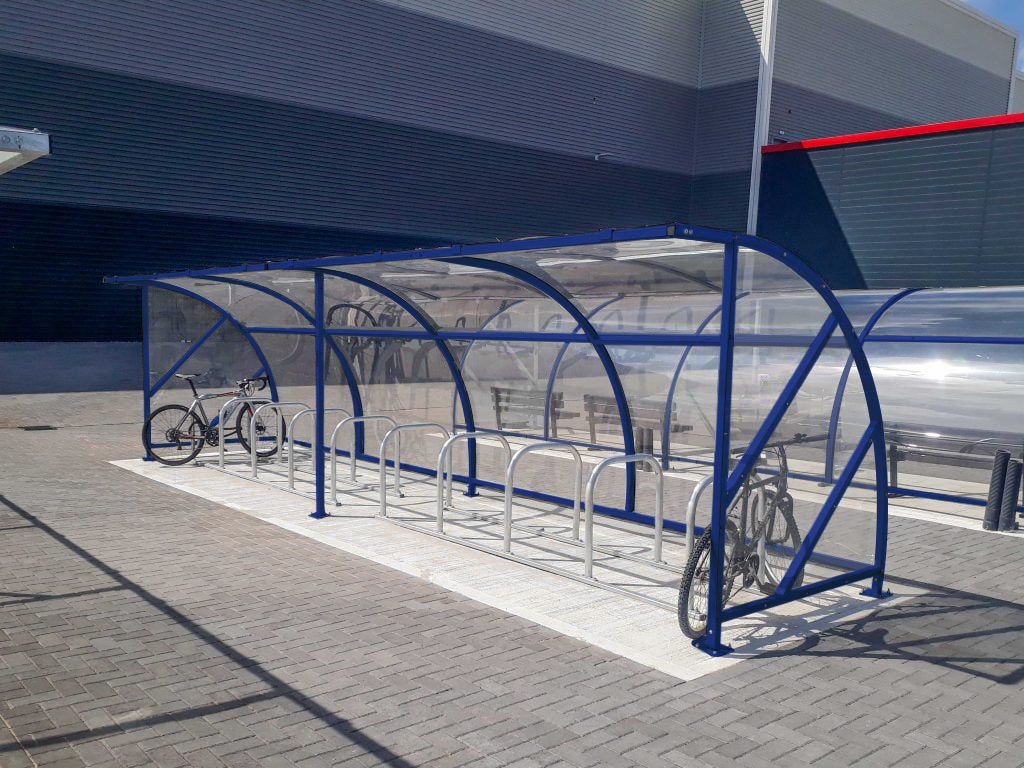
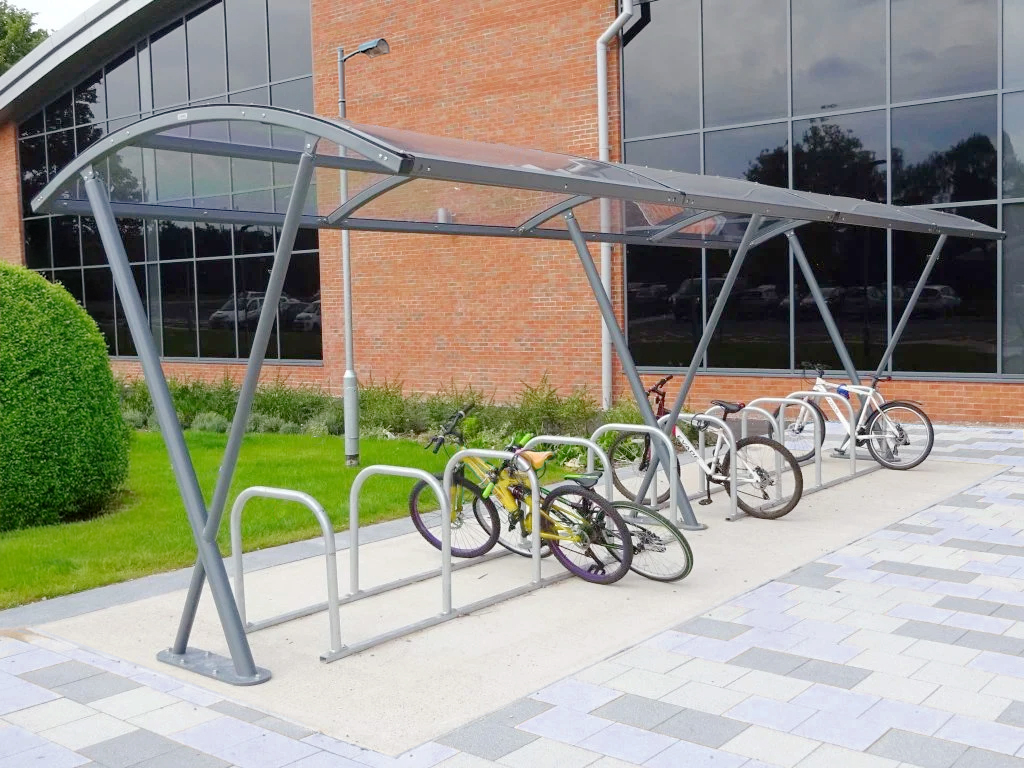
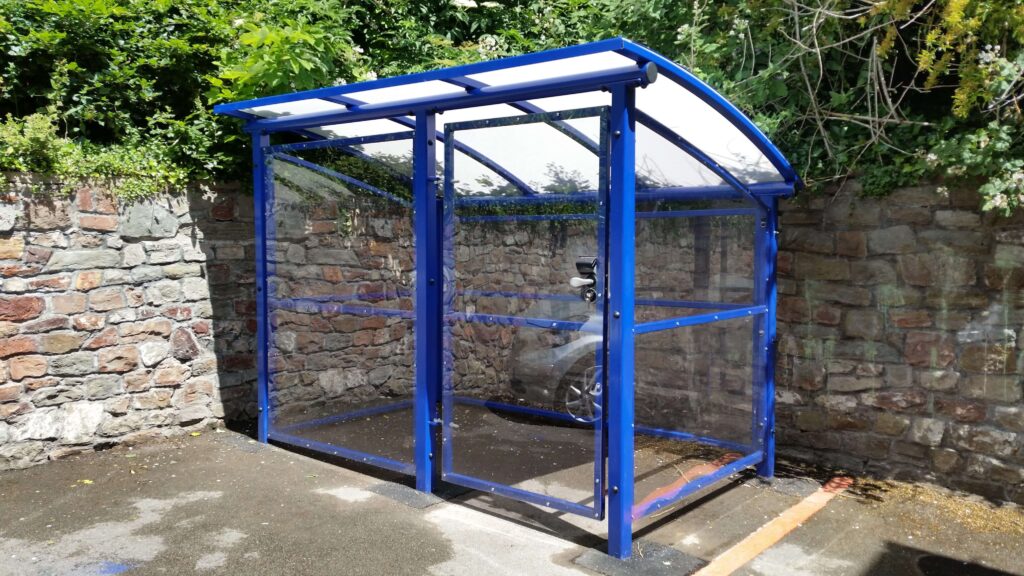
Here at A&S Landscape, we offer outdoor solutions that can benefit schools and businesses to utilise the most of their outdoor spaces. If you have an interest in cycling or want to encourage the use of bikes in your school, then you might be after a cycling shelter.
Without further ado, let’s take a look at some of the most interesting cycling statistics to date.
20 Statistics About Cycling
- 47% of people in England aged 5 and over owned or had access to a bicycle in 2020. (Source: National Travel Survey 2020)
- This demonstrates a 5% increase compared to the 3-year average of 42% for 2017-2019. (Source: National Travel Survey 2020)
- Cycling usually only constitutes 1% of all traffic mileage, compared to 77% travelled in cars and taxis. (Source: Cycling UK)
- In February 2020, the UK government announced that it would be expanding its Bikeability programme, offering an additional 400,000 training places to 8-10 year olds to give them the skills they need to cycle safely and confidently on the road. (Source: GOV.UK)
- In January 2022, the government introduced eight key changes to the highway code, including three new rules about a new ‘hierarchy of road users’. These changes are intended to improve the safety of people walking, cycling, and riding horses. (Source: GOV.UK)
- Between 2016 and 2021 the number of people participating in cycling in England increased from 5,044,400 to 6,479,900, an increase of over 28%. (Source: Sport England)
- In Wales, 4% of adults surveyed in 2020 claimed to cycle at least once a week for active travel purposes. (Source: GOV.Wales)
- In England the largest proportion of trips by bike are undertaken for leisure purposes. 34.7% of respondents said they had cycled for leisure within the previous month, compared to 20.7% saying they cycled for travel purposes. (Source: Walking and Cycling Statistics, England)
- The UK e-bike market was valued at just under 0.20 billion GBP in 2021, and it is expected to reach over GBP 0.36 billion by 2027. (Source: Mordor Intelligence)
- Mountain bikes are the most popular type of bike in Britain, with one in three (33%) of bike owners owning an MTB. (Source: bikebiz)
- Between 2015 and 2020 an average of 104 pedal cyclists died each year in reported road casualties. (Source: GOV.UK)
- In 2022 the average person went on 15 bike rides and covered a distance of 57 miles. (Source: Barriers Direct)
- 11.5 % of UK adults say cycle to work schemes would get them commuting via bike instead of other forms of transport. (Source: Barriers Direct)
- Cycling at a steady pace for 1 hour burns around 500 calories. (Source: Tredz)
- 4 in 10 people say that many of the short journeys they make by car could be made by bike. (Source: Brake)
- On average, 30 cyclists die for every billion miles travelled, compared with just two car drivers. (Source: Brake)
- According to a survey of 2,005 UK cyclists, 37% of cyclists feel safe all the time when cycling alone. 56% feel safe sometimes, and 7% never feel safe cycling alone. (Source: Cycle-SOS)
- As of 2021, two-thirds of people travelled by foot or wheels five days a week. (Source: Edinburgh Council)
- Men are twice as likely to use a bicycle for travel on a regular basis than women as only 12% of women cycle once a week and 73% of women living in cities never ride a bicycle. (Source: Our Supporting Life)
- Nearly half of all journeys in London were walked or cycled between April and June, up from 19% before the pandemic. (Source: Our Supporting Life)
The Impact of Covid-19 on Cycling
- Cycling increased up to 200% in the UK following the implementation of a national lockdown at the beginning of 2020. (Source: Sport England)
- Between March 2020 and March 2021, Scotland’s National Monitoring Framework’s automatic cycle counters recorded a 47% increase in cycle journeys compared to the previous year. (Source: Annual Cycling Monitoring Report)
- Walking and cycling proved to be the most popular form of outdoor activity during the initial Covid-19 lockdown phase, with people cycling for exercise up from 8% in week one to 13% in week six. (Source: Sport England)
- The amount spent on new bicycles increased significantly during the first year of the pandemic, increasing from £940 million in 2019 to £1.18 billion in 2020. (Source: Ethical Consumerism Report 2021)
- The average length of cycling trips increased by 26% between 2019 and 2020. (Source: Walking and Cycling Statistics, GOV.UK)
- In terms of miles cycled, in 2020 the UK’s average mileage per year increased dramatically to 5.03 billion as a result of the changes to many lifestyles due to the Covid-19 restrictions. (Source: Cycling UK)
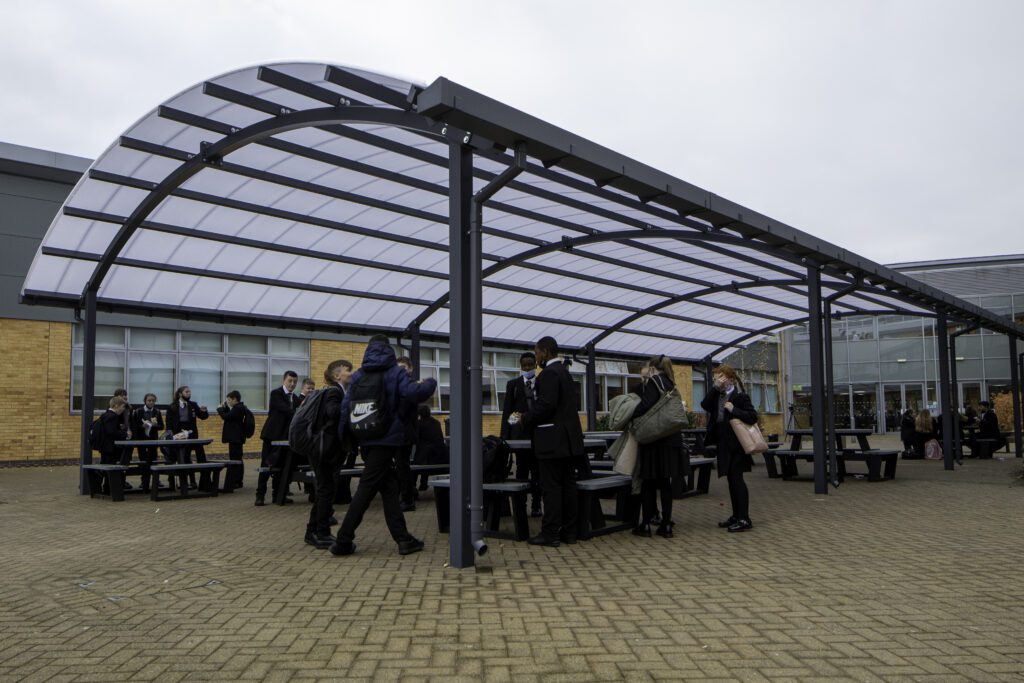
Invest in a Cycling Shelter with A&S Landscape!
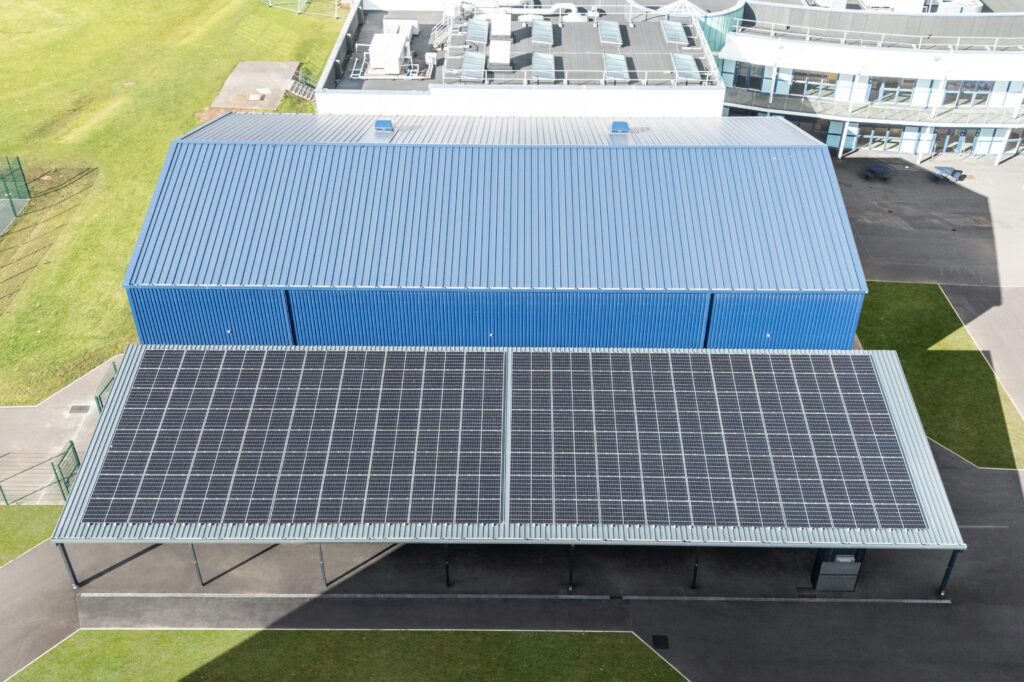
As we can see from the data above, cycling has been and will continue to be a popular form of not only transport, but also exercise. Not only does cycling have positive benefits on the environment, it also improves cardiovascular health and encourages people to get outside.
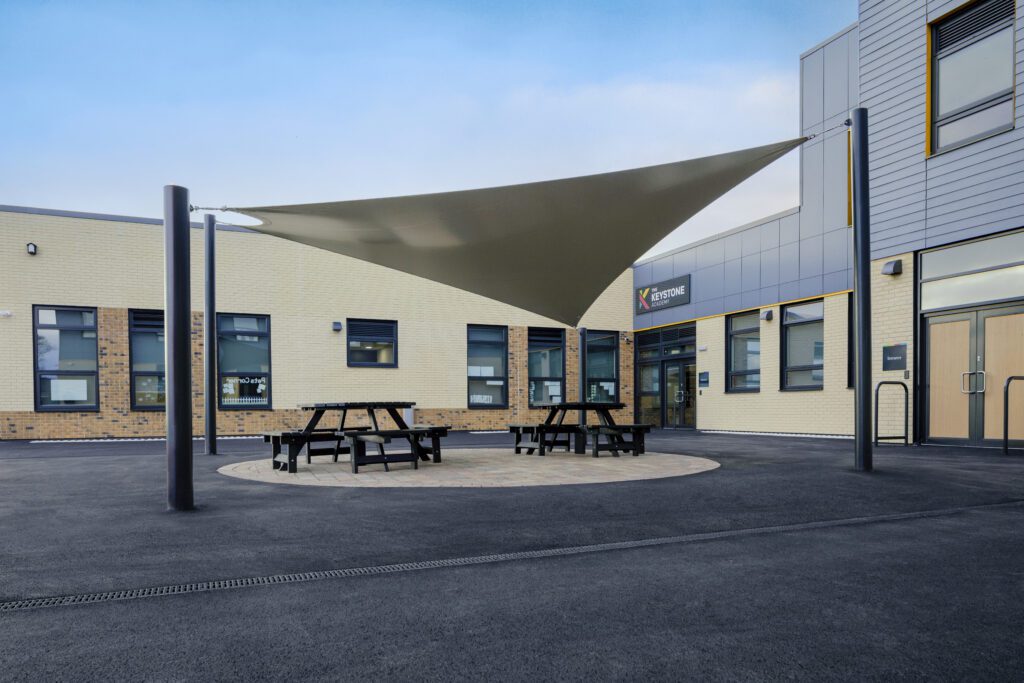
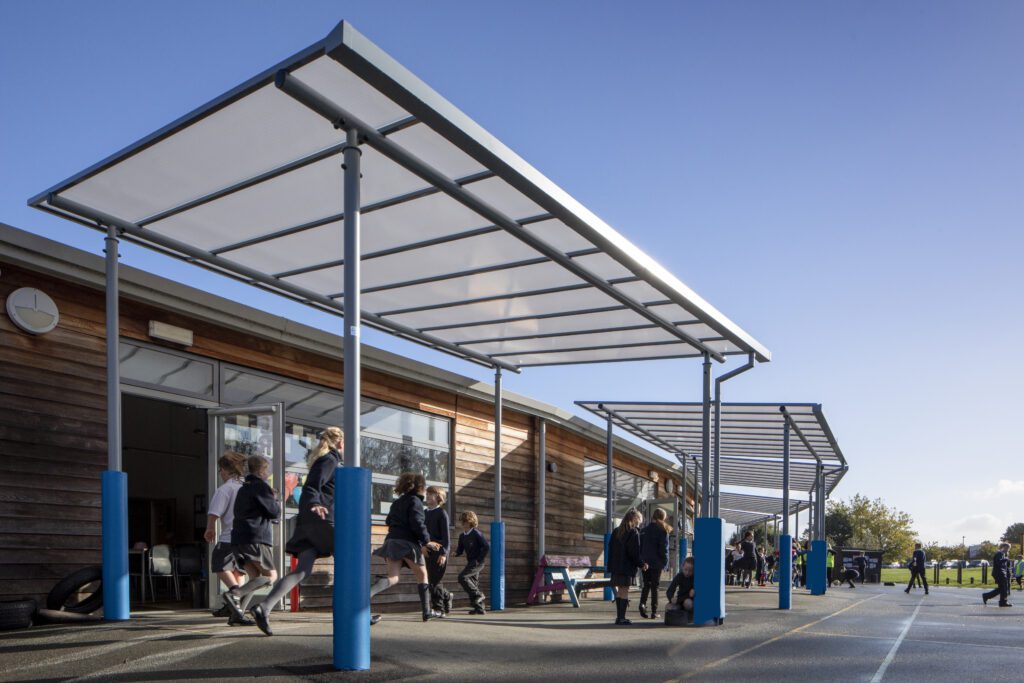
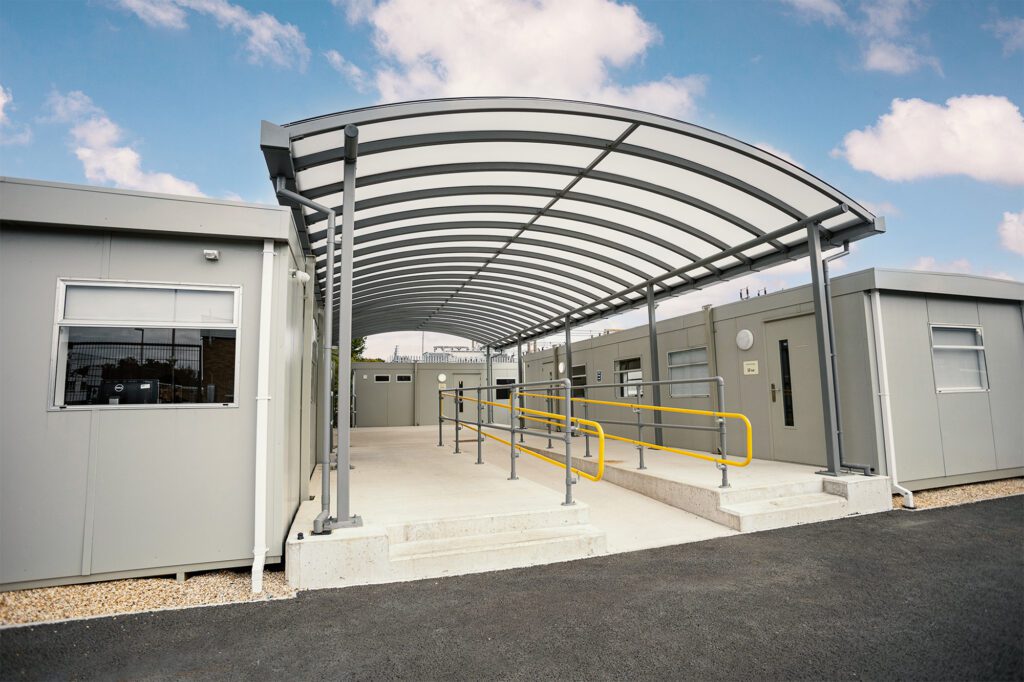
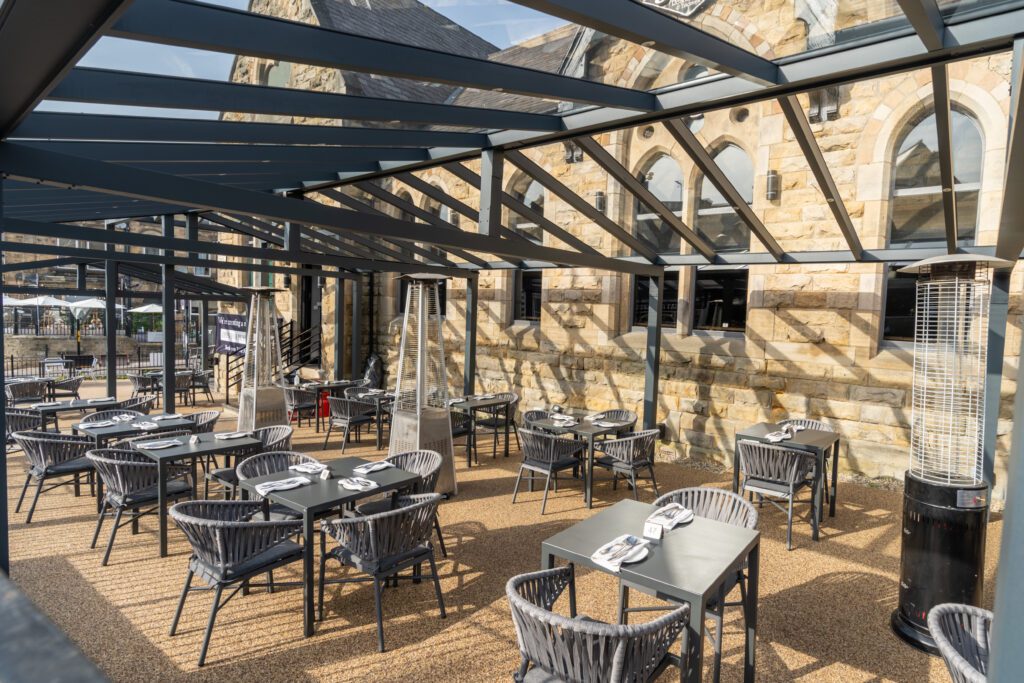
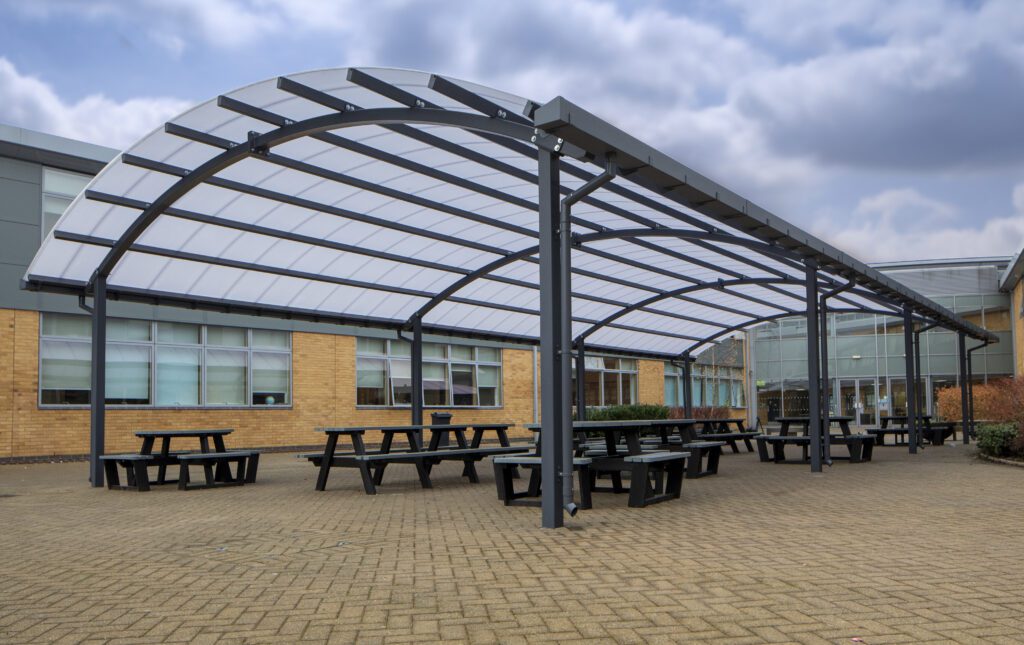
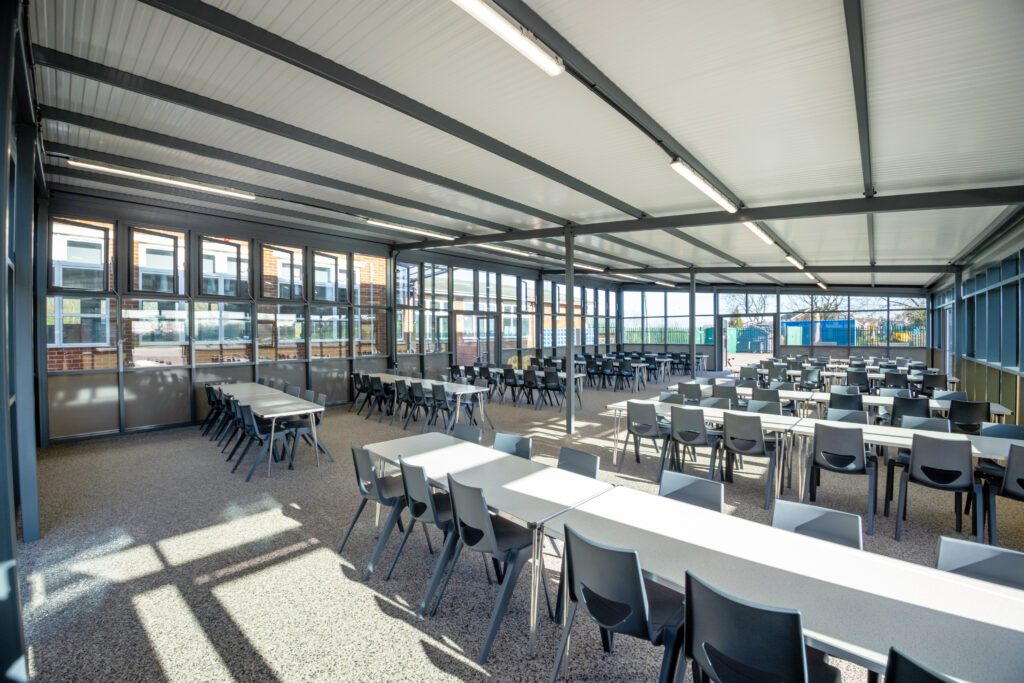
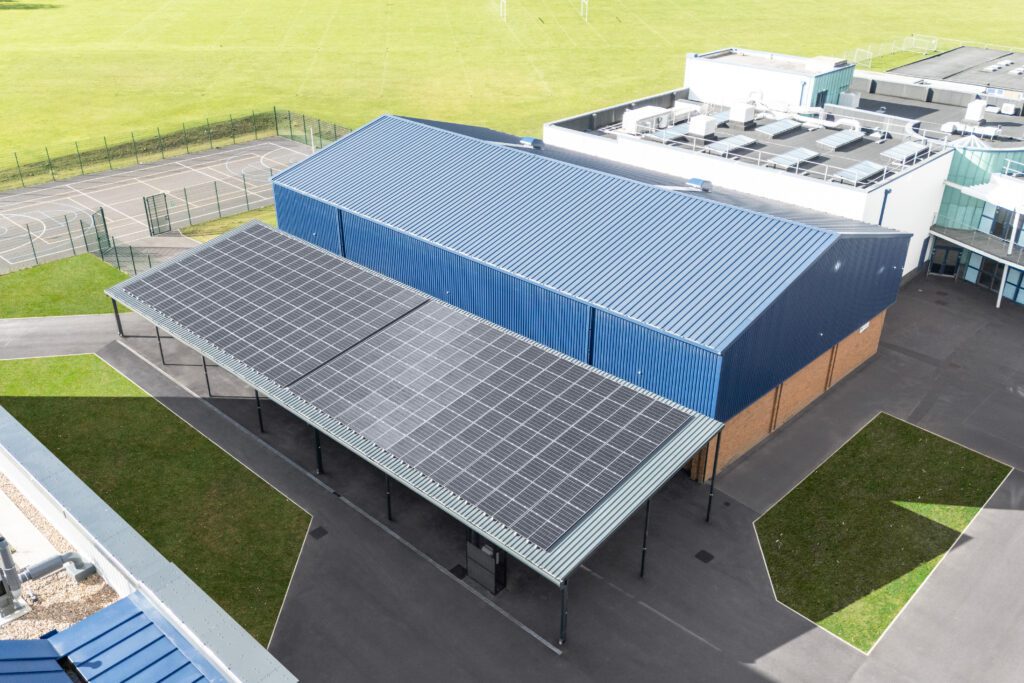
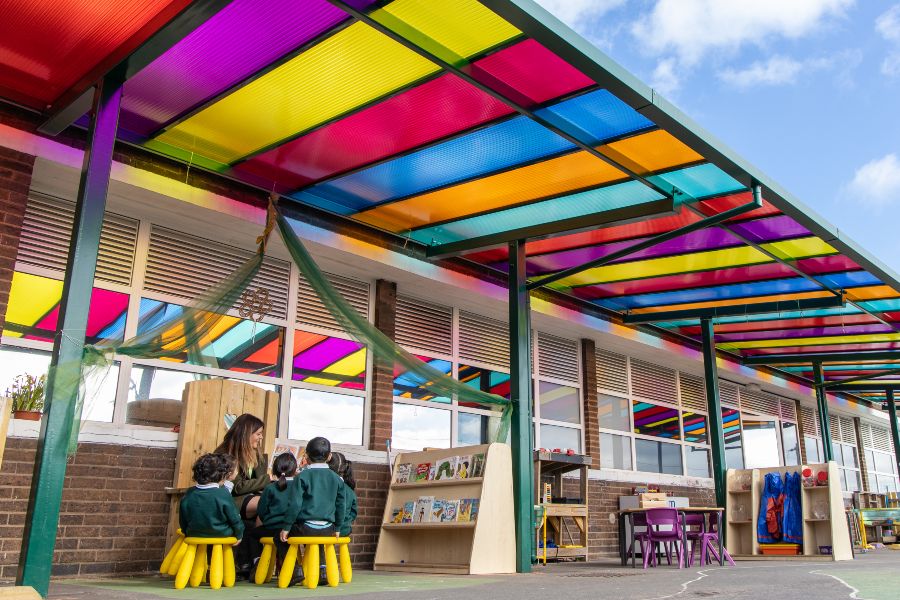
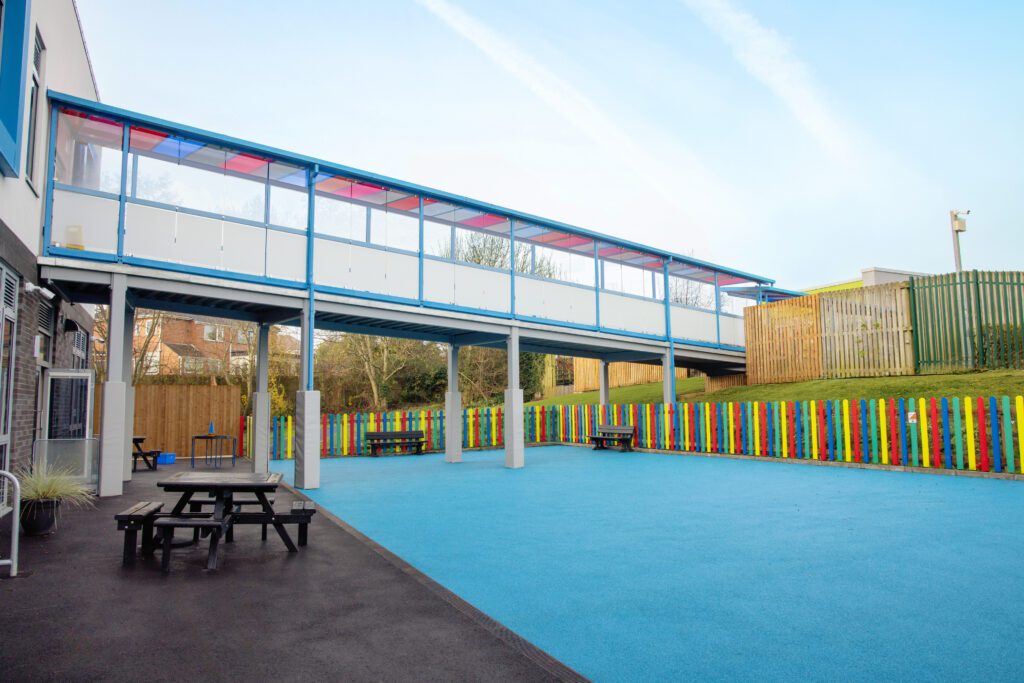
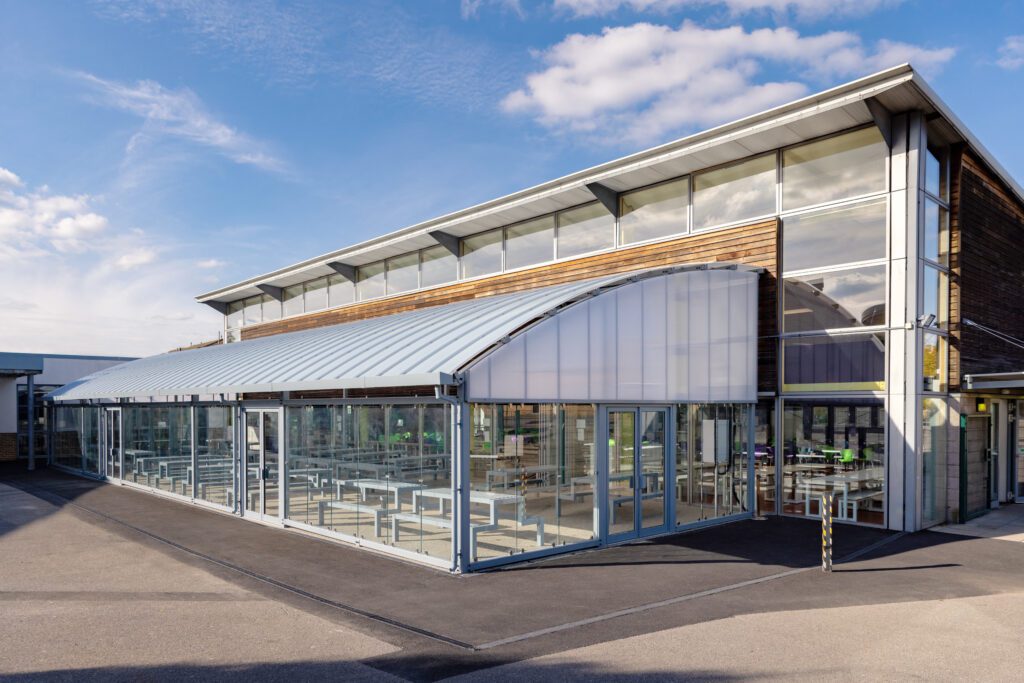
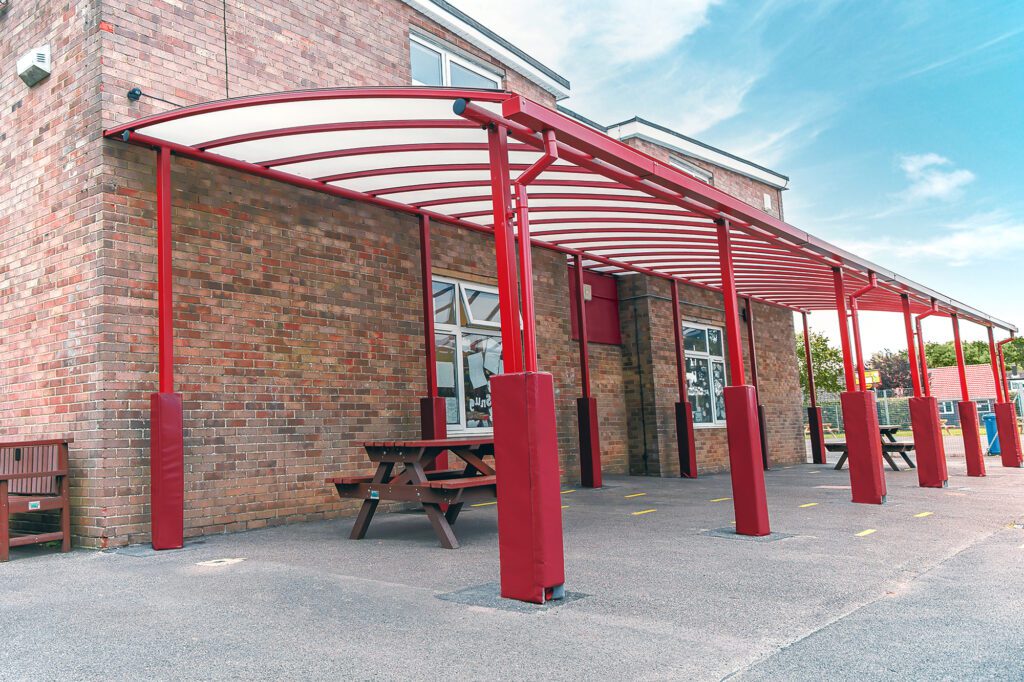
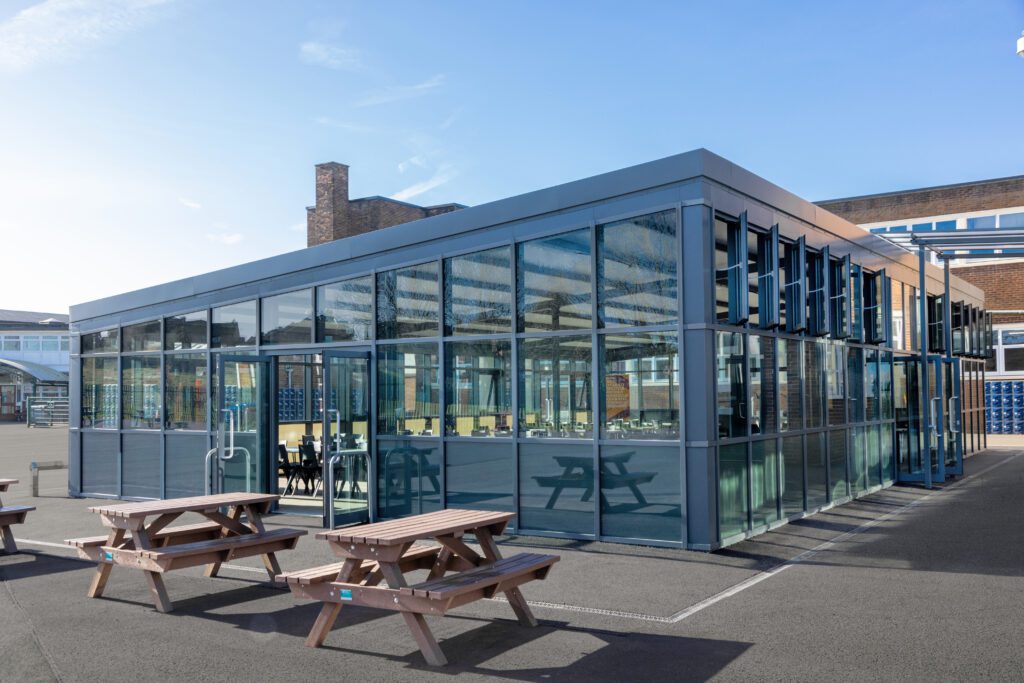
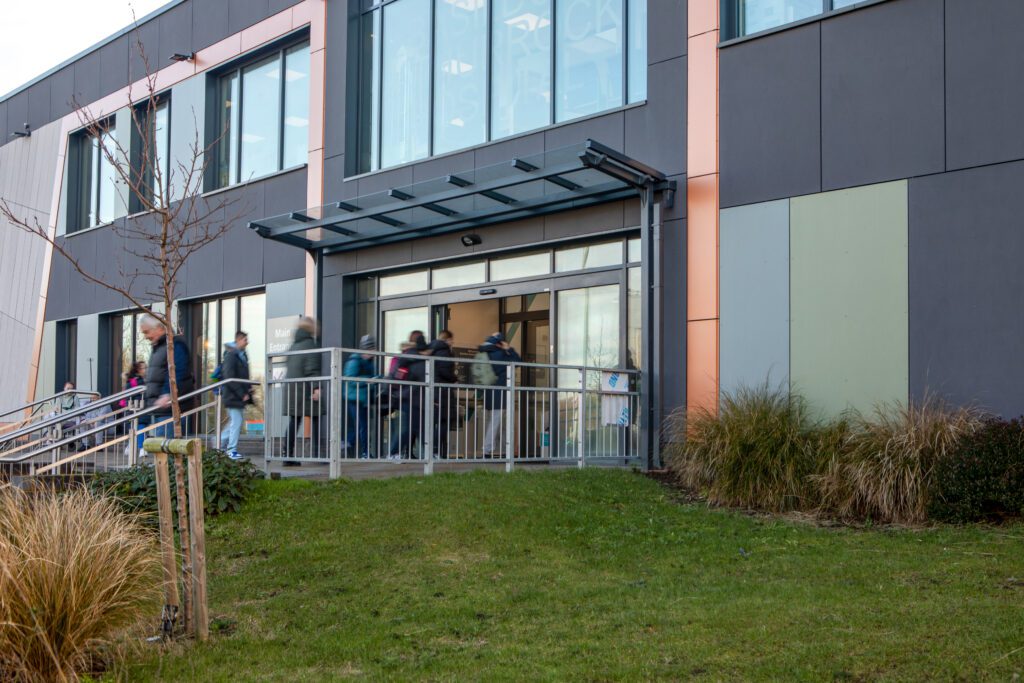
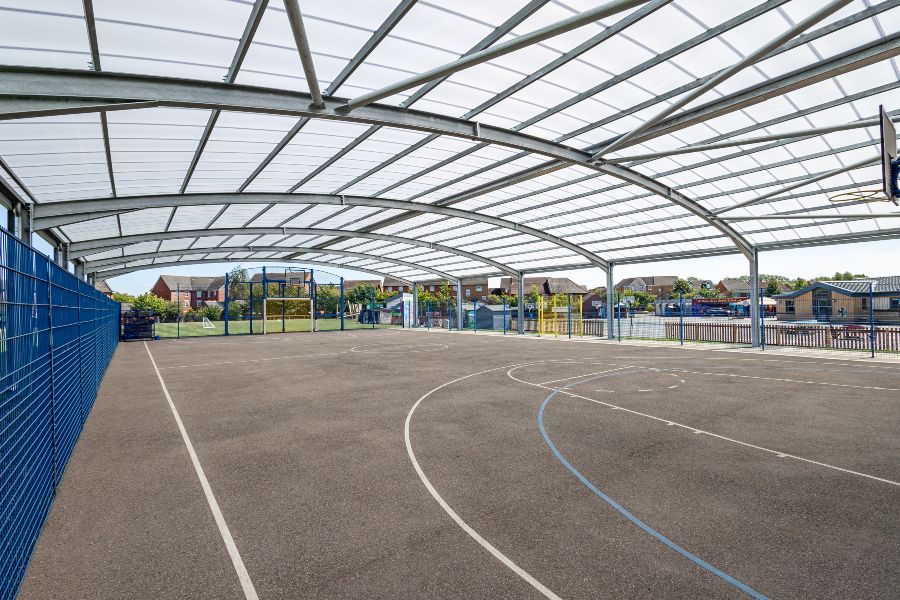
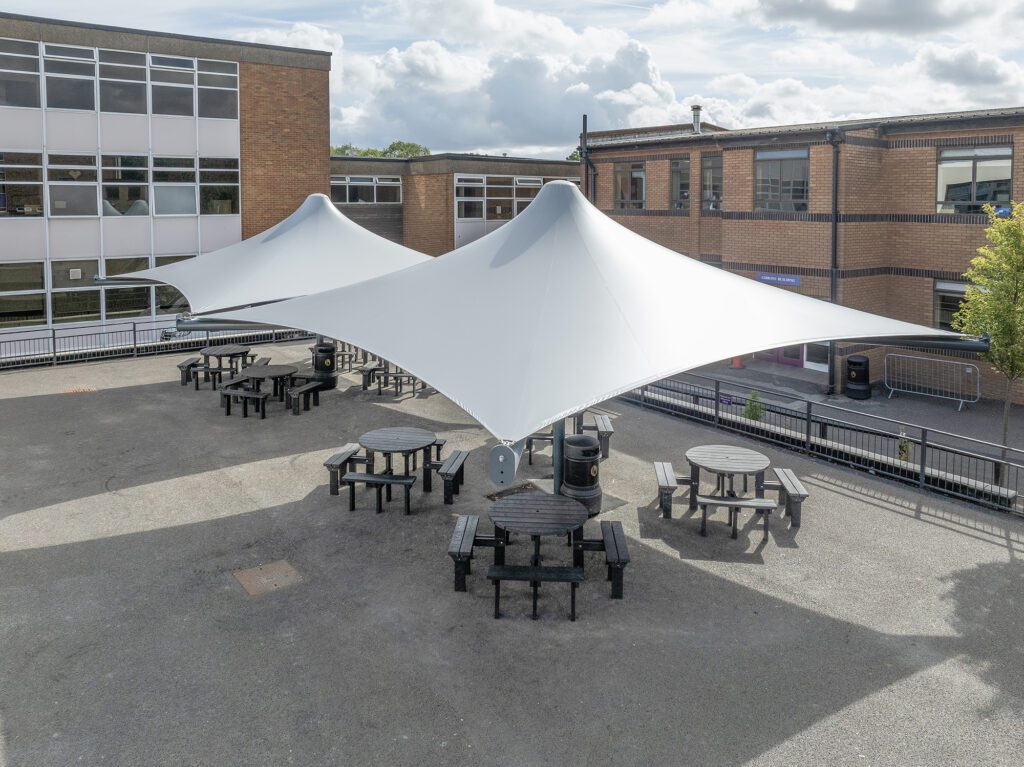
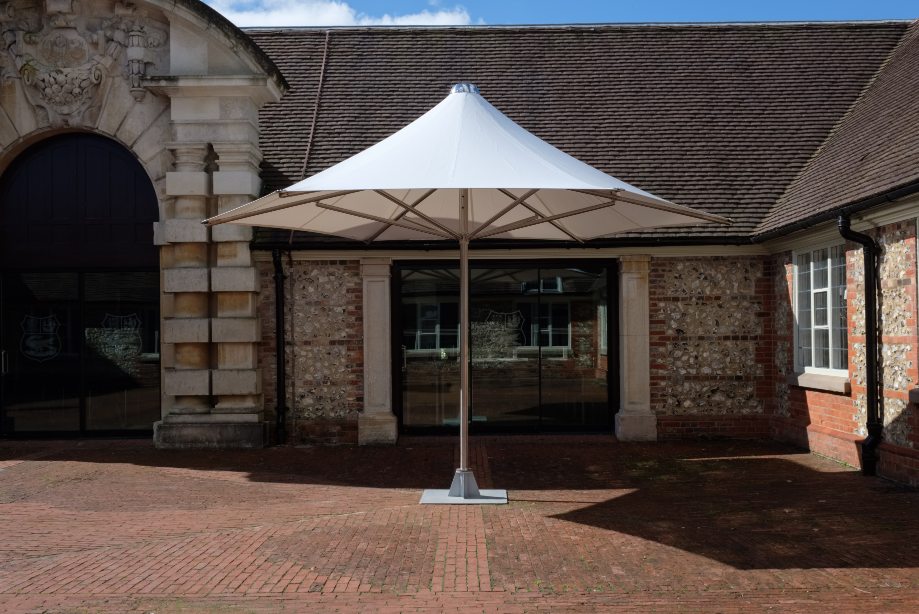
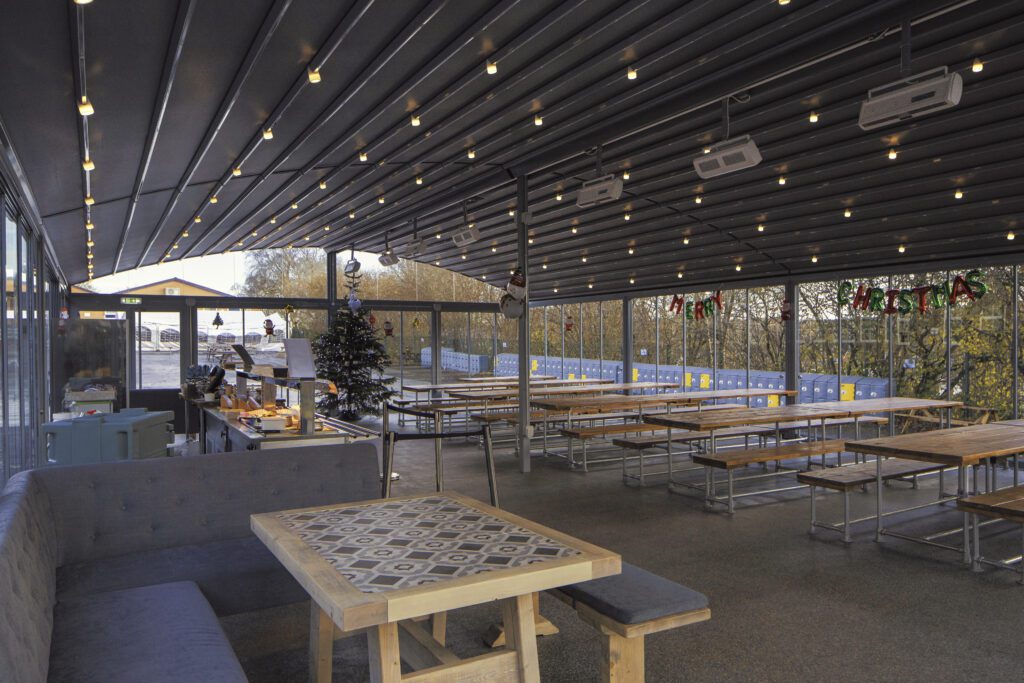
If you’re looking for a practical and visually appealing solution to your outdoor space, A&S Landscape offers completely bespoke canopy solutions, suitable for schools and businesses.
Please get in touch via our online contact form for further enquiries. A member of our team will be more than happy to chat you through your options and provide you with a canopy that meets all expectations!